

 The secret to staying on track with your website results is to check your analytics every day. I know – there’s a million other things to do.
One thing I’ve found works for me is setting up a Google Analytics Dashboard for content. It gives me an overview of everything I need at a glance.
If I need to give senior management a view of ‘how the website’s doing’ in 10 seconds, I can.
My personal Google Analytics Dashboard for content
For my own site and any I’m working on, I put all the key metrics for content in widgets and just change the segment (traffic grouping) as I need – like from All Users to Mobile Traffic – to see how successful the site is for different factors.
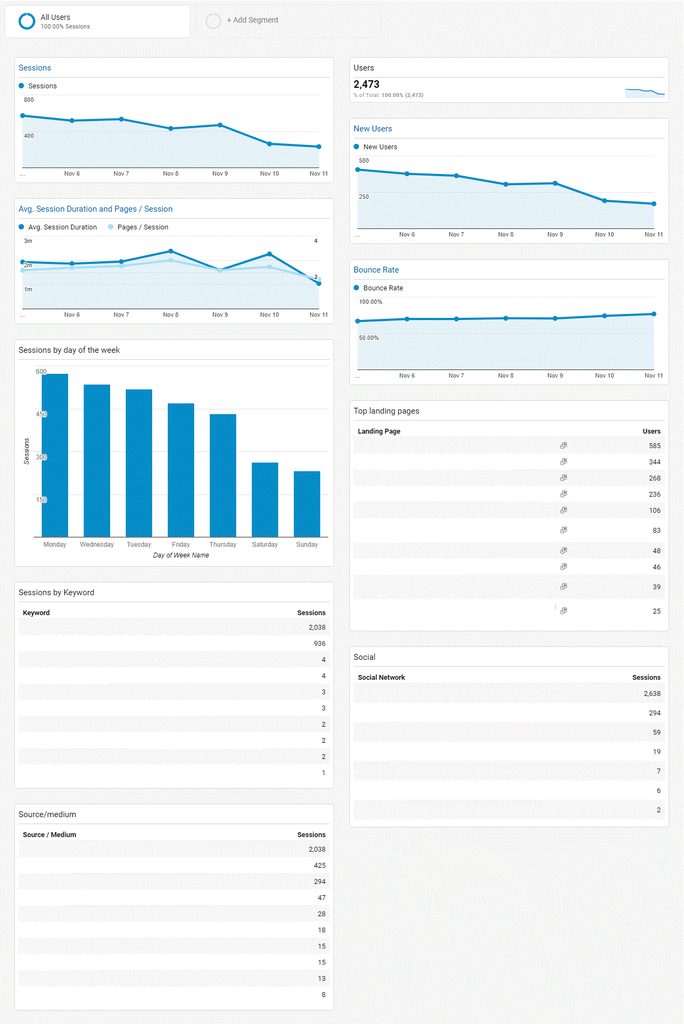
1. Sessions
How many times your site is browsed – bearing in mind that it could be 10 people going on the site 400 times. Sessions are a useful measure of how useful your site is but not how much new attention you’re gaining.
2. Users
Total users, who may have had many sessions in your selected date range. Users are your baseline for how many humans you’re attracting.
3. New users
The number of first-time users during the selected date range.
4. Average session duration compared with pages per session
How long people are spending and how many pages they see. Sessions duration is useful for gauging how engaging your site is but always remember that they could be landing on a page, then leaving a browser tab open while they pop for a cigarette.
Tools like SessionCam are a better way to track if people are actually engaging with a page because you can observe how people are using calls to action, heat maps and form-fills.
5. Bounce rate
People who leave the site after one page. A high bounce rate is generally seen as a bad thing but it needs context. Pages that are designed to give an answer to a question as quickly as possible – like any page on GOV.UK – will have a high bounce rate if successful, because the searcher has found the answer they needed from one page.
However – if you have a commercial website, you probably want people to browse on. More pages, more time spent = a greater chance of you converting the traffic.
6. Sessions by day of the week
Your most successful days. Are weekends lower because you’re not as active on social? Do you publish your newsletter on a Tuesday? Sometimes, ebb and flow might be around payday or other temporal things. Sometimes, a dip is a sign YOU need to do something different.
7. Top landing pages
Your most successful pages for drawing people to the site. This will tell you:
- The pages that have particularly good SEO (including structure, keyword phrases and quality) and are attracting organic traffic
- Pages that you’re driving lots of traffic to from paid search or social media, for example
8. Sessions by keyword
The vast majority of keywords are untracked but with enough data, you may still notice important trends over time.
9. Social
Which platforms are working best for you.
10. Source/medium
Where traffic is coming from and in what form e.g. Google / organic search or Facebook/referral (direct link).
So, there you have it. My top secret Google Analytics Dashboard – my content marketing success revealed! Set it up, then check it daily. You’ll pick up trends sooner and put things right before you’ve wasted money.