Whenever money is spent on marketing, there is one question that absolutely must be answered…was the investment worthwhile?
In this article, we give a brief rundown of what can be learned from an analytics dashboard. We’ll explore how that data can be interpreted and put to practical use. YouTube will be used as the example, largely because its analytics dashboard is exceptionally well designed. For video producers, the insights it provides are so useful and informative that it becomes almost impossible not to improve their use of video to attract new customers.
What Does The YouTube Analytics Dashboard Give Us?
Let’s take a look at the overview first of all.
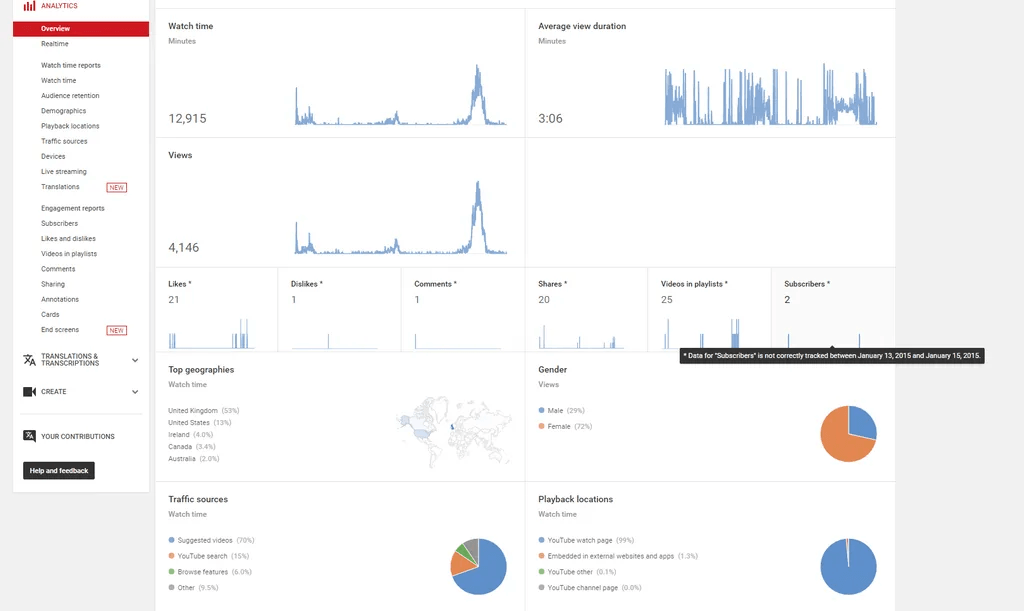
Down the left hand side of the screen we see all of the different reports that are available to us. There is a lot of information here. Let’s start with the overview itself. It tells us how many people have viewed the video, how long they watched for and a little bit about the viewers. We can see that most viewers were female, most of them watched the video on YouTube and most of them found it not by searching but by way of it being a suggested video. Let’s look a little closer at this information and see how we can usefully interpret it.
How Long Did People Watch And Why Is That Important?
We know from the overview that 4,146 people had watched the video at the time of data capture. You can also see that the average watch time was three minutes and six seconds. For a video that is just under ten minutes long, let’s take a look at that and try to find out what could have been done better.
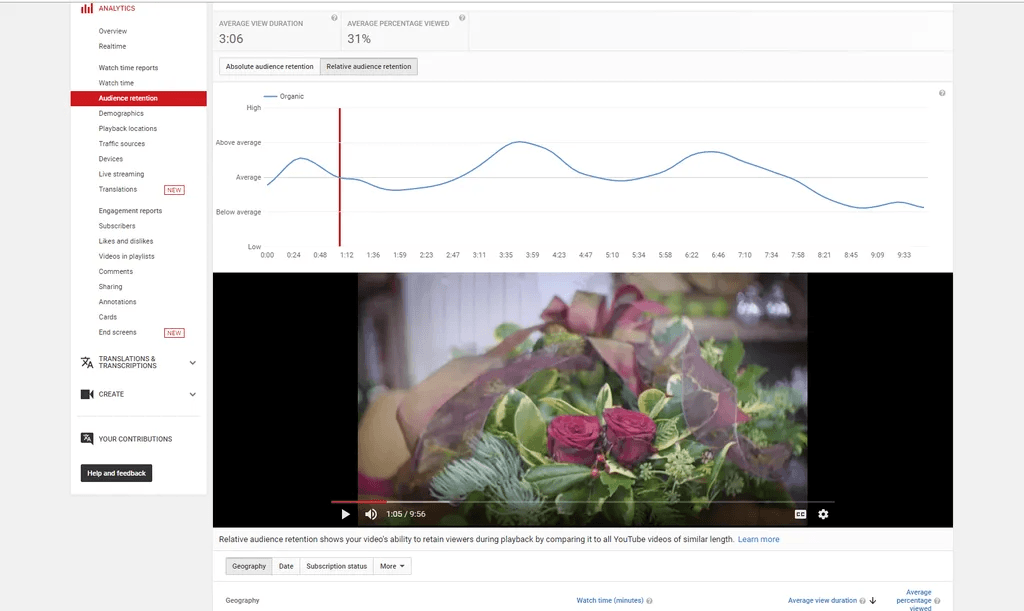
What we see here is a live playback of the video underneath a graph showing us our audience retention throughout the video. There are two options for showing this. The first shows us retention as a percentage of the starting audience. The second option shows audience retention compared to other YouTube videos.
What we see now is that this video starts with below average views but as it goes on it retains more viewers than other videos throughout most of its length. This is a “How To” video and it’s telling that as we near the end of the creation demo and move into the phase where we see the beauty shots of the completed wreath viewing drops off. Why? You might conclude that people are working along to the video building their wreaths and as they near completion they aren’t that interested in how beautiful our completed work is. They are interested how how their work has progressed.
How Do I Use That Knowledge?
The video needs something to retain viewer interest after the one minute mark. We want as many people to watch our skilful work as possible as the point is to establish our expertise and get people to want to buy from us. We can also see that the video could do with being shorter. The last two minutes are only marginally useful and yet making those two minutes incurred production costs. That’s money we can save next time.
Who Is Watching?
The middle section shows us that our work is of great value to a lot of viewers. They are watching when most other videos have lost most of their views. This must be to do with the power of “How To” videos to engage people who want to make or create for themselves. They are watching and working along. So the next video I make for this client needs to be another “How To”, and I need to make it quicker and punchier.
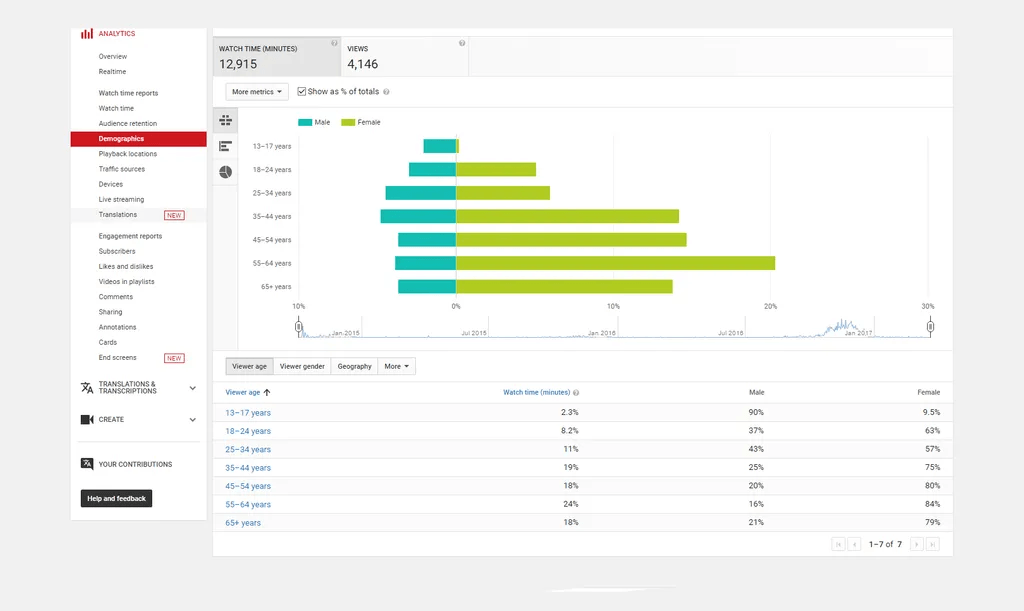
In this demographics report we can see who is watching. The data shows that most viewers are women and that they are older women.
When did people watch?
This video was a “How To” for a Christmas door wreath. It should come as no surprise then that the majority of views come in late November and early December. What the watch time report does show is that views are climbing year on year. If you go back to the overview you will remember it told us that most of our views come as the video is now a suggested choice on this subject matter. As the video gained views, and repeated views over each festive season the YouTube system noticed this and added the video to it’s suggestions. In its third Christmas live the video got more views than in all of the previous two years combined.
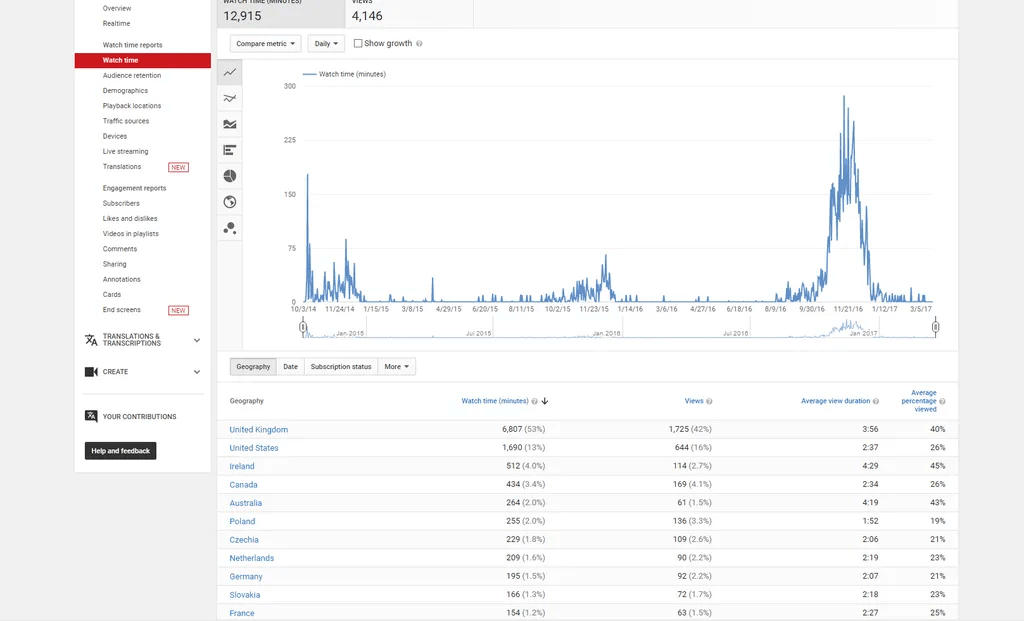
The data below the graph shows us that the huge majority of views are in English speaking countries. The best news is that most are in the UK where the business is located and where the views will get us new customers.
The analytics for every video you upload to YouTube are easily available by clicking on the “analytics” button under your video. There is so much more data available here and so much more we can do with it!
Free Digital Marketing eGuide
We’ve put together this simple, practical guide to help you get to grips with the basics and get started with marketing your business online.
It’s packed with simple, easy-to-understand tips on building an online presence that helps you stand out, creating an effective strategy to focus your efforts, and avoiding common mistakes.
Our Digital Marketing Services
Available as part of our digital marketing solutions.
Our team of experts will work closely with you to:
- Understand your business challenges and objectives and tailor one of our proven digital marketing solutions to your needs and budget.
- Set up and manage your digital marketing activity, so you can focus on running your business.
- Get you results – fast – and maximise your return on investment.